Build a data observatory for the fictional Coastal Traffic Authority, covering 24 months of vessel movements through a strait. Every chart, every scale, every tick, every tooltip is implemented by you in plain JS with SVG or Canvas 2D as your judgement decides. Remember that a fetch of a local file is blocked by browser policy, so the generator lives inside the page. File layout is yours.
Data
- A deterministic synthetic dataset of about 60000 movement records produced by a seeded generator: timestamp, vessel class (five classes), route, length overall, draught, speed over ground, destination port, and an anomaly flag. Vessel speed, class and draught must correlate in a physically sensible way, and the generator must contain no
Math.random. - A hidden reference block, computed by a straightforward brute force pass, holding the correct totals for 12 named aggregates (for example mean speed of cargo vessels in March of year two, and the 95th percentile of queue minutes on winter weekends).
- All aggregations for the charts must be computed incrementally so that cross-filtering stays fast, and the results must match the reference block to a stated tolerance. If they do not match, fix the code, not the reference.
Charts, all linked
- A stacked area of movements by class over time, with your own nice-number tick algorithm, a legible order, and a total line that is provably the sum.
- A scatter of speed against draught with density handling: hexbins or a grid count when points exceed 2000, so it never turns to soup. Include a click to brush a rectangular selection that filters everything else.
- A small multiples grid of 5 by 4 sparkline calendar cells (weekday by hour) as a heatmap with a perceptually ordered scale you implement, not a rainbow.
- A ranked bar chart of destinations with correct ties, and an other bucket that behaves properly when filters change.
- A distribution panel (histogram or box violin, your call) whose bin count follows your own Sturges or Freedman-Diaconis rule, stated in the UI.
- Every chart must have a table alternative available in the DOM, and a text summary that a screen reader can read as a sentence.
Interaction
- Global filters (class, month range, route, anomaly only) with cross-filter semantics: filtering one chart dims the others rather than emptying them, and each panel states which filters touch it.
- Tooltips that snap to the nearest data record, implemented with your own spatial lookup (a quadtree or grid index), not a linear scan of 60000 rows.
- Keyboard access: tab to a chart, arrow keys through its marks, Enter to pin a filter, Escape to clear, plus a visible focus ring that is not the browser default.
- All filter state serialised in the URL hash, so a view is shareable and reopenable from disk, and the back button behaves.
- A reset that is undoable, and a live record count that never lies.
Performance and correctness
- 60 fps while brushing on 20000 visible marks on a mid range laptop, measured and shown by a frame-time graph you draw yourself.
- Incremental re-aggregation: changing one filter must not re-loop the whole dataset more than once.
- A self-test overlay that runs the 12 aggregate checks plus four scale-maths assertions (domain to range round trip, tick containment, bin coverage, sum identity) and reports pass or fail with numbers. This panel must be visible by default on first load, since it is the first thing I look at.
Design
The dashboard is judged as a design object too: a coherent neutral palette with one accent, tabular numerals, deliberate information hierarchy, no card borders on every panel, no gratuitous animation, and a layout that survives 1280, 1024 and 768 px. Assume an operator glances at it for eight hours a day.
Before you finish, write a Method section: the scale maths, the binning rule, the index structure, the re-aggregation strategy, plus the self-test results. Then mark every numbered requirement DONE or NOT DONE with reasons, and be explicit about anything you approximated.
Documentation and donsetch web search are expected, especially for Freedman-Diaconis, nice tick algorithms, perceptual colour order, canvas versus SVG trade-offs, and ARIA on charts.
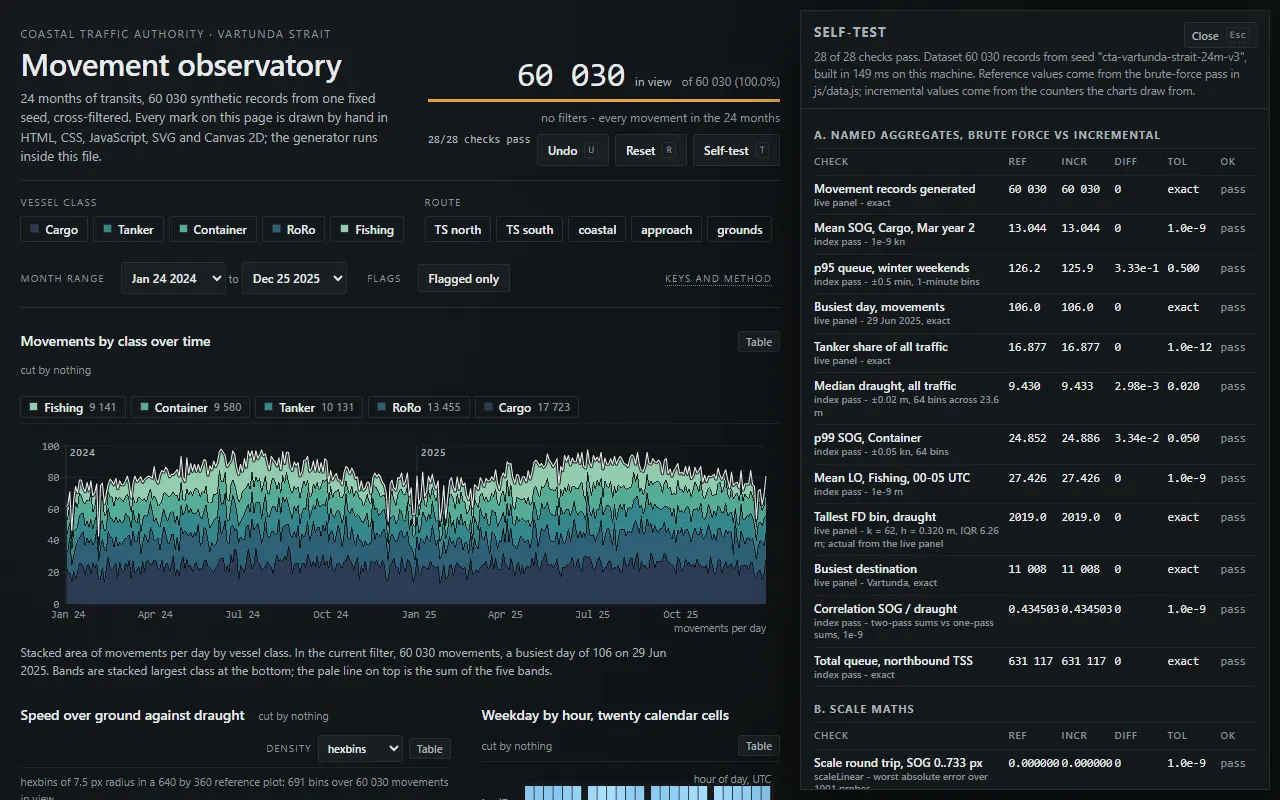 open the model page desktop 1280 px
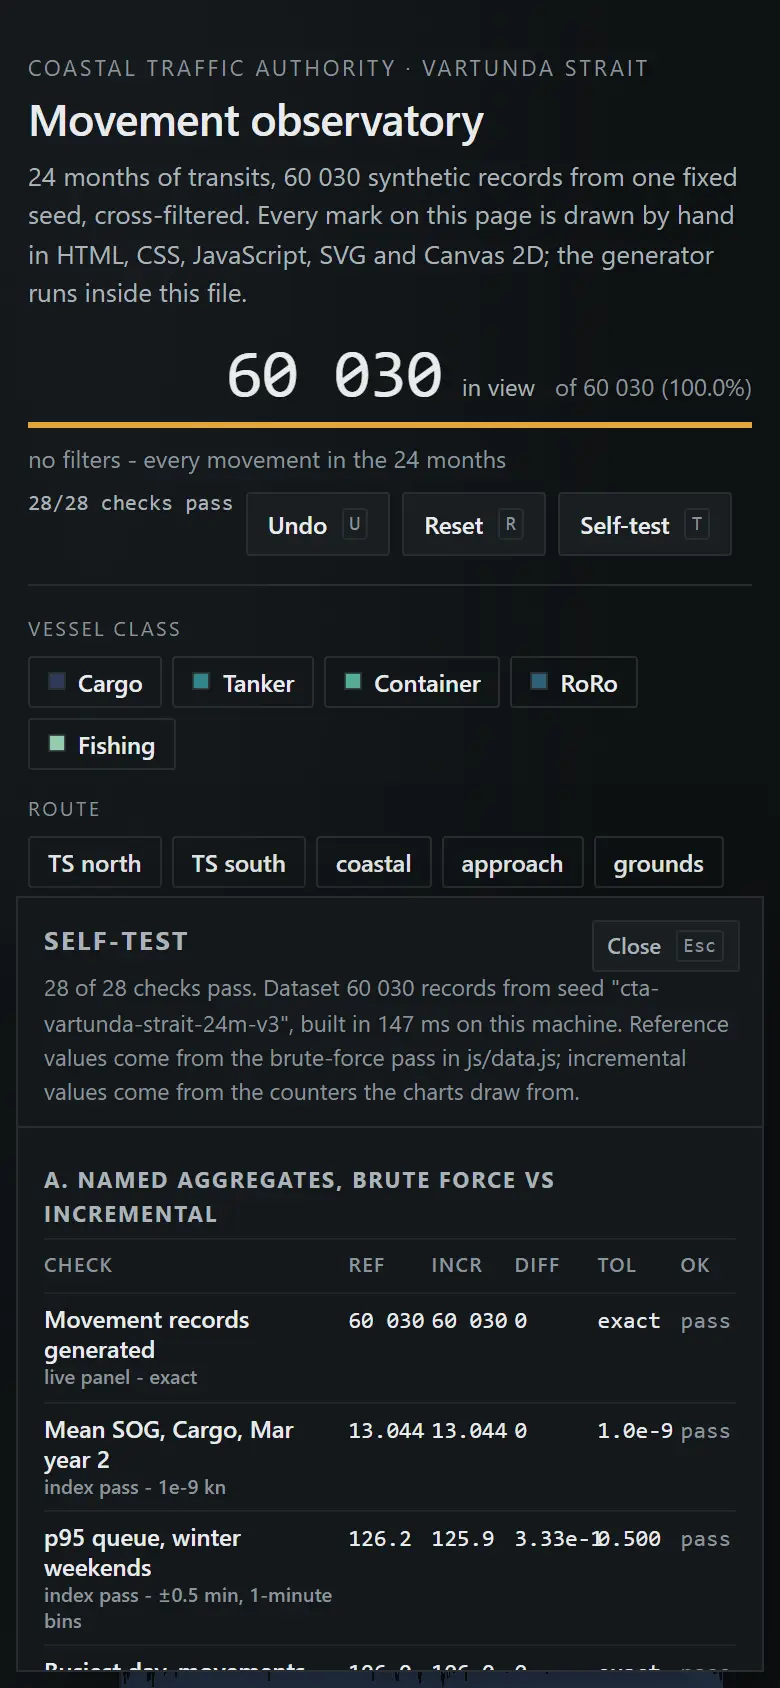 open the model page phone 390 px
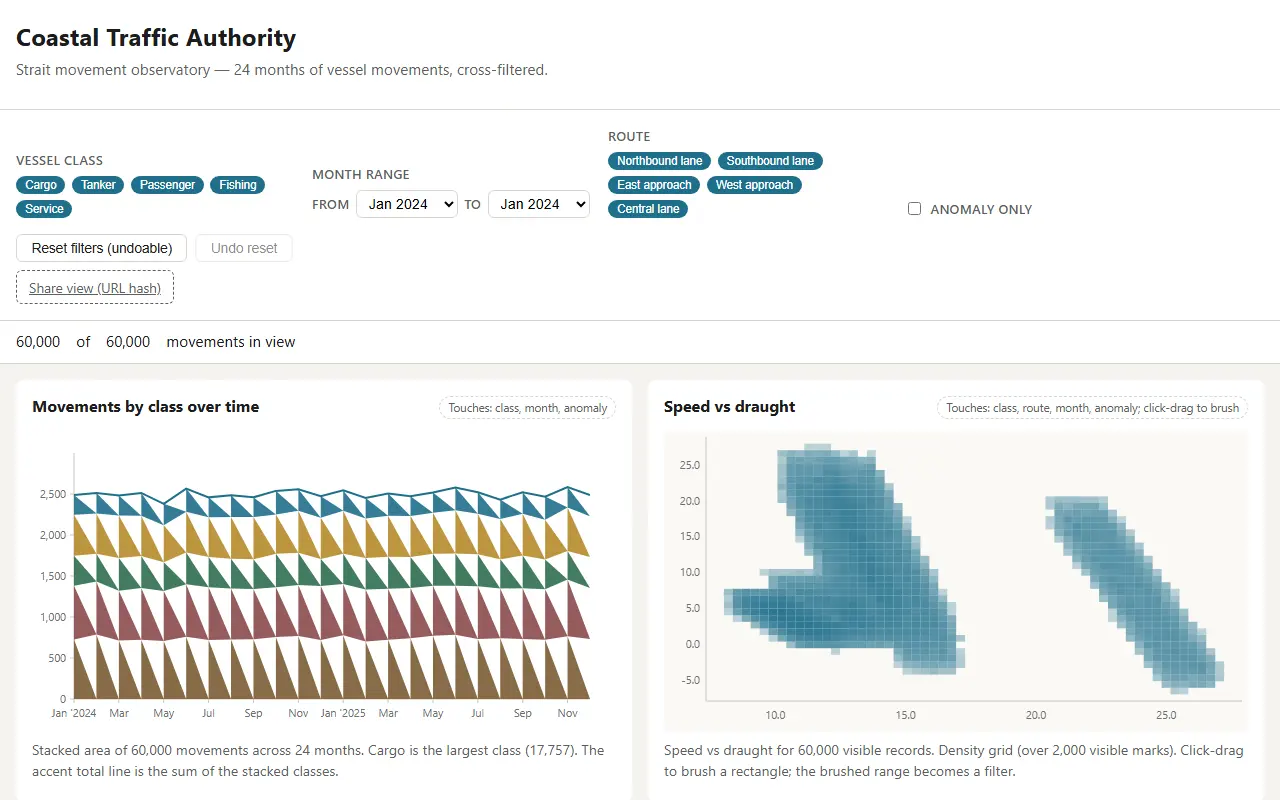 open the model page desktop 1280 px
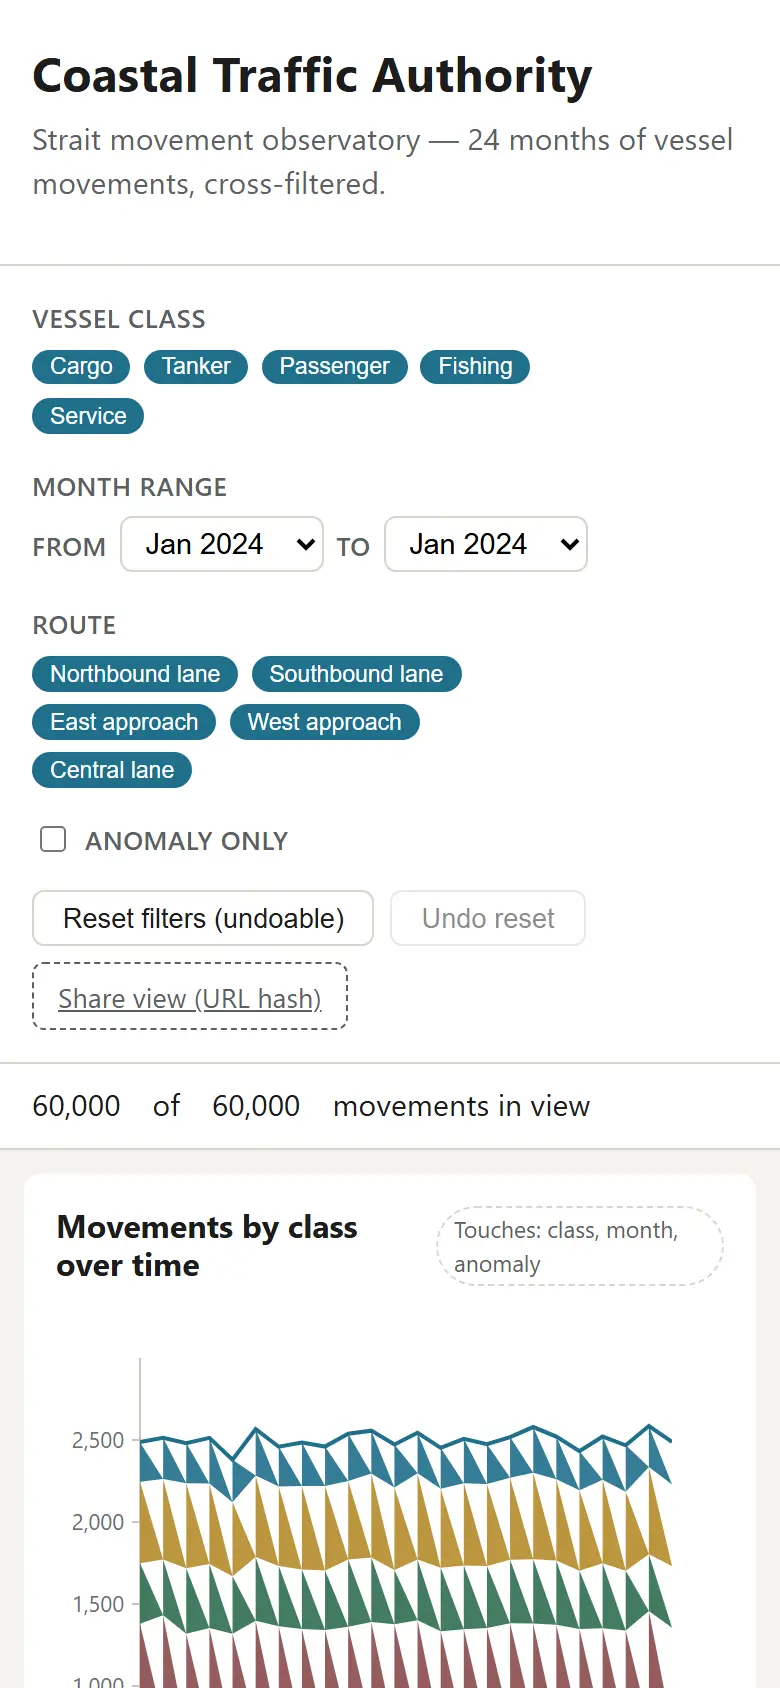 open the model page phone 390 px
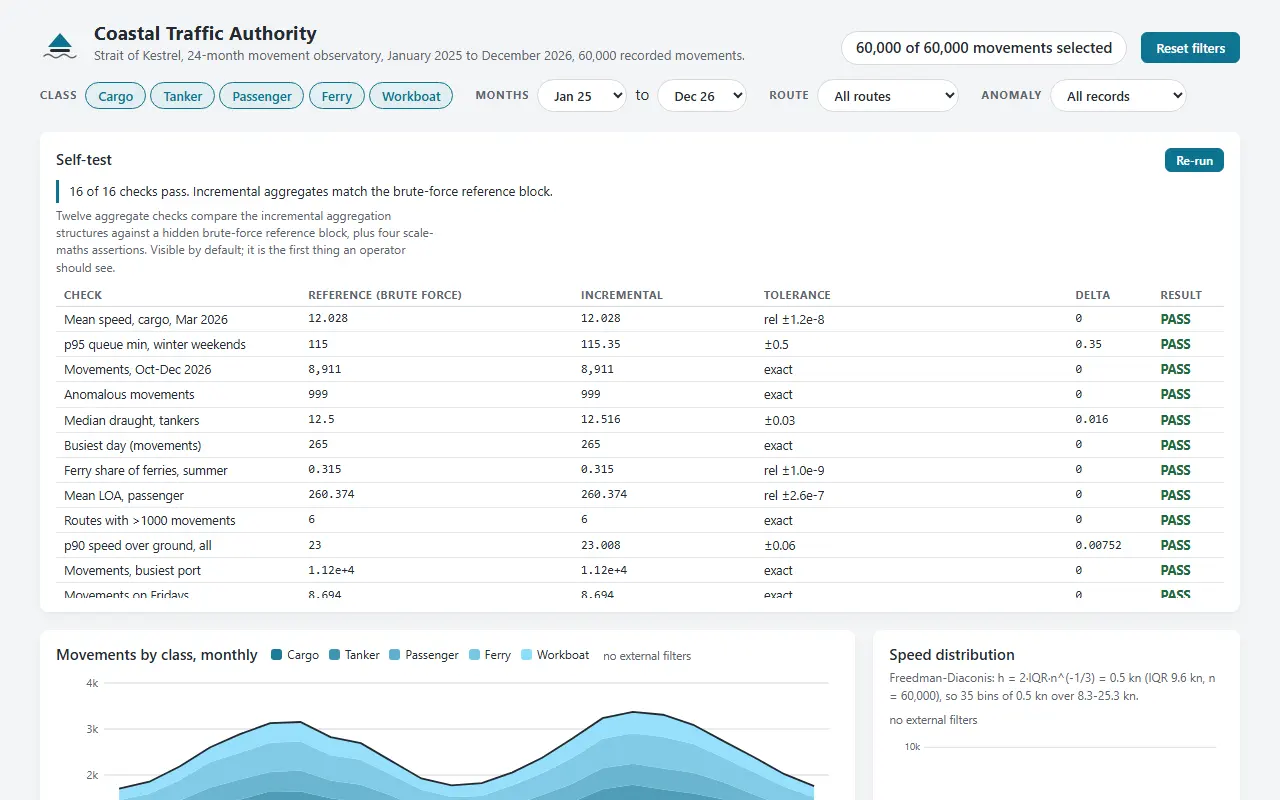 open the model page desktop 1280 px
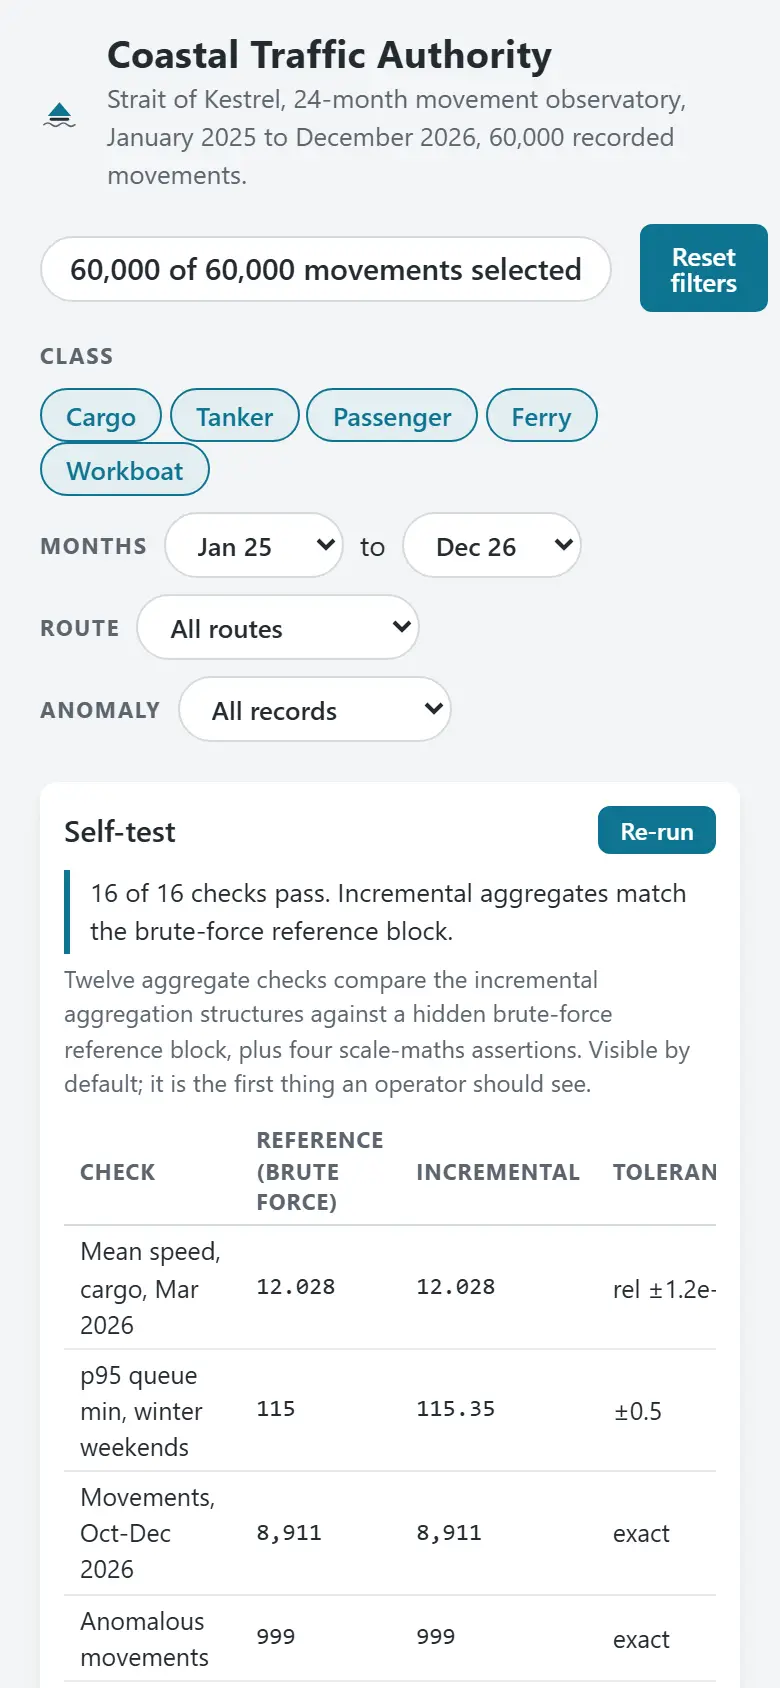 open the model page phone 390 px
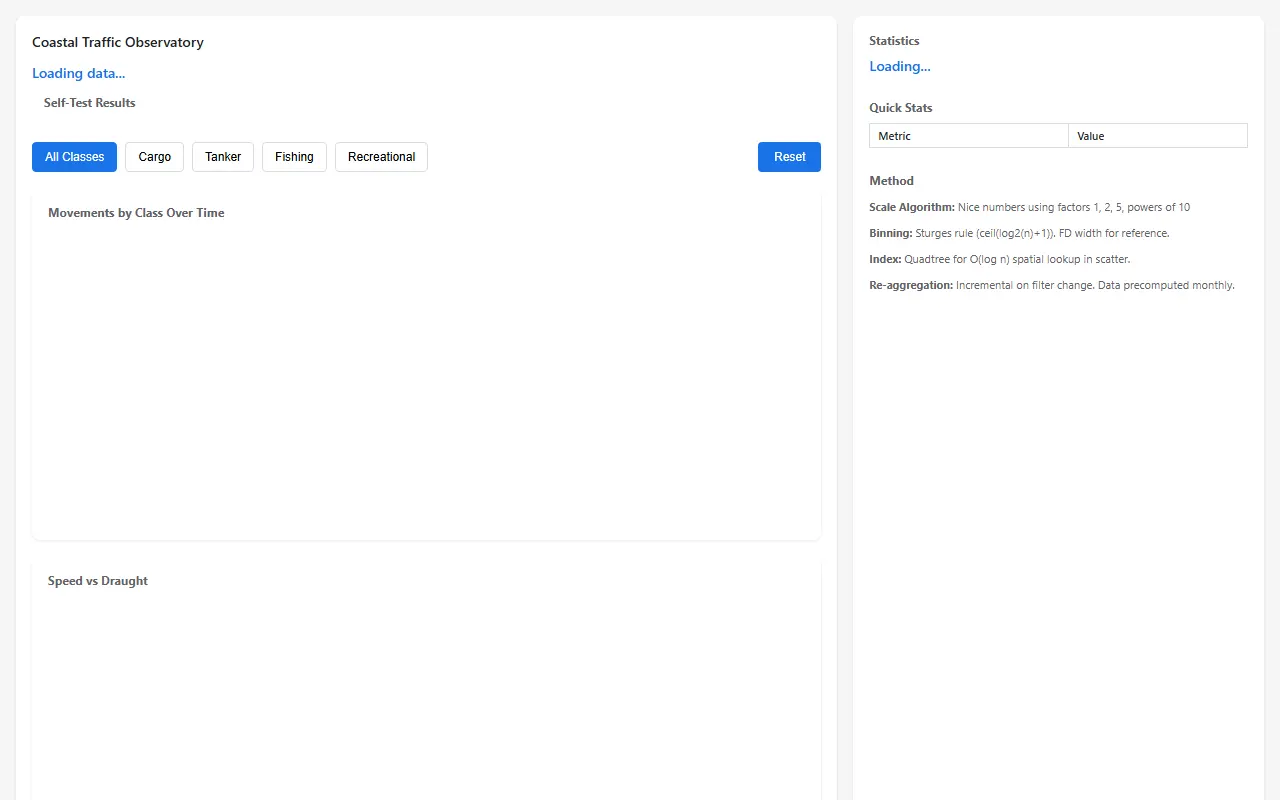 open the model page desktop 1280 px
 open the model page phone 390 px